The impact of Autism CRC on the Australian autism research landscape
A recent Macquarie University study has demonstrated the significant impact of Autism CRC’s current investment program on the autism research landscape in Australia.
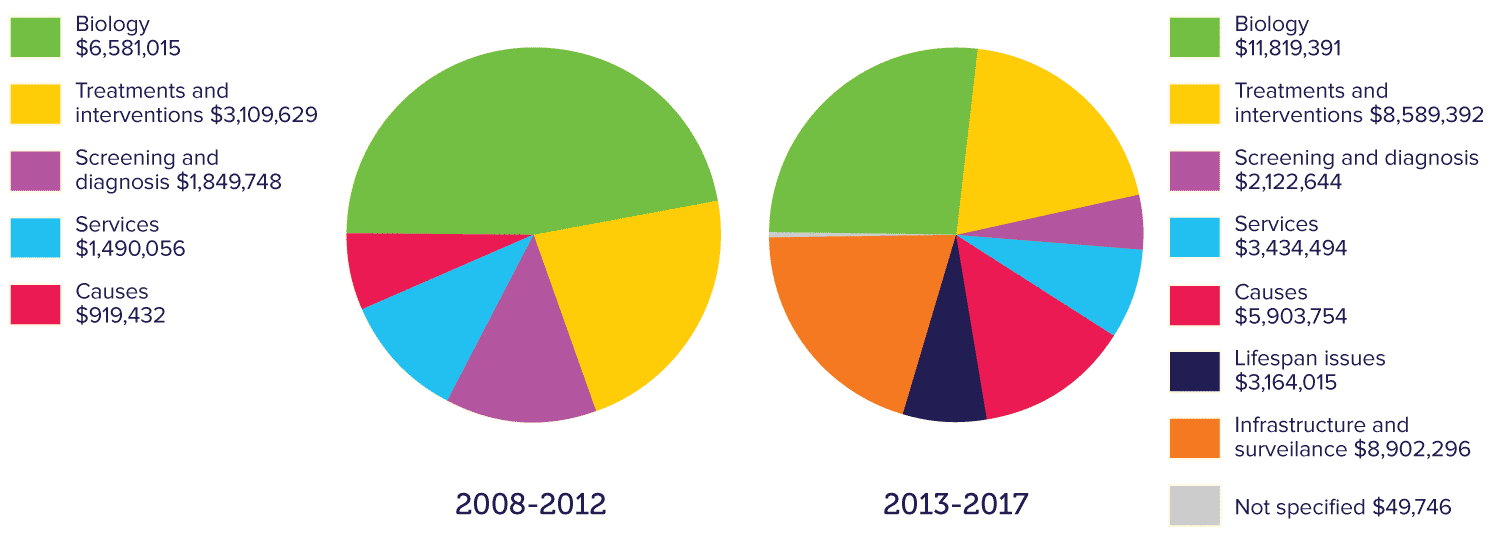
Autism CRC’s program has prioritised research topics that address needs across the lifespan, defined by the stakeholder community. The Macquarie University study of Australian Research Council, National Health and Medical Research Council, and Autism CRC research funding (den Houting, J. & Pellicano, E., 2019) showed that in the period 2008 to 2012, prior to the establishment of Autism CRC, a total of 40 autism-specific research grants were active in Australia. This represented a total investment of approximately $14 million. The analysis of that funding shows almost half was allocated to biological research, with no research funding allocated to lifespan issues, infrastructure or surveillance.
In the five years following the inception of Autism CRC in 2013, there has been a clear shift in both the quantum and distribution of autism research funding. A total of 113 autism-specific research grants were active in Australia, with a total value of almost $44 million (including almost $20 million in Autism CRC cash investments).
The analysis noted that research funding was distributed more evenly during this time period with lifespan issues, infrastructure and surveillance now being allocated significant funding. It is noted that, in Autism CRC’s case, funding allocated to infrastructure includes significant investment in post-doctoral personnel working on our Adulthood program.
There is still work to be done in ensuring that research is being directed to end-user priorities, addressing the whole lifespan. As we move to the next phase of our work beyond our founding Commonwealth CRC Program, we need to ensure that this continues to be a fundamental driver.
Figure 1: Distribution of Australian autism research funding in 2008-2012 (left) and 2013-2017 (right)